How to set up Metrics & Dashboards
Beautiful graphs for everything running on your box. This guide covers how to access it, log in for the first time, configure the basics, and where its data lives so you can back it up.
1. What is Metrics & Dashboards?
Collect time-series metrics with Prometheus and visualize them in Grafana dashboards. See CPU, RAM, disk, network, and per-service metrics across your entire SparkBox in real time.
2. Before you start
Prometheus scrapes metrics every 15s and keeps 30 days of history. Grafana comes pre-wired to Prometheus and ships with two ready-made SparkBox dashboards - just log in.
3. How to access it
Once it's enabled, Metrics & Dashboards runs on your SparkBox at:
http://<your-NAS-IP>:3030Open the SparkBox folder under Dashboards for the ready-made System and Containers views
4. First login
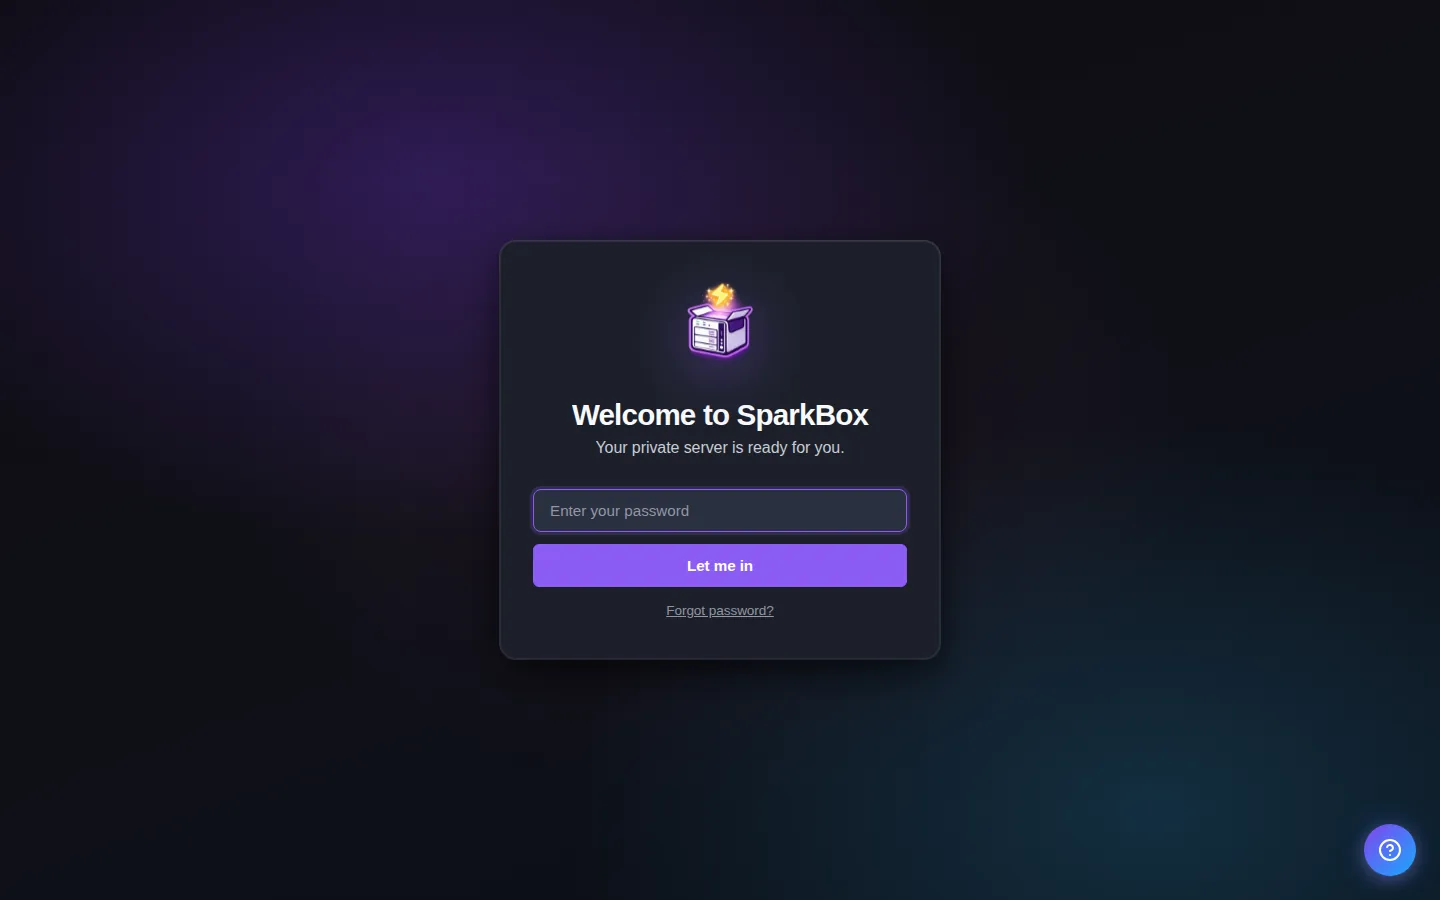
Username: admin. The password is the Grafana Admin Password you set when enabling the module - it's also listed in your SparkBox dashboard under Settings. Once in, open Dashboards and look in the SparkBox folder.
If it instead asks for a password you didn't set, check Settings → Passwords in your SparkBox dashboard — every auto-generated credential is listed there.
5. Settings you can change
You can set these when you enable the module, or later from Apps → Metrics & Dashboards in the dashboard:
- Grafana Admin Password — Password for the Grafana admin user (required)
6. Where your data lives
Metrics & Dashboards's config and persistent data are stored on the SparkBox host under:
/opt/sparkbox/modules/metrics/config/Backups via the SparkBox dashboard's Backup tile include this directory by default, so a single restore brings Metrics & Dashboards back to its current state on a fresh install.
7. The two dashboards that come ready-made
Log in to Grafana and open the SparkBox folder (left sidebar, Dashboards). 'SparkBox System' shows your box itself - CPU, memory, every disk including your storage pool, and network. 'SparkBox Containers' shows the same per app, so you can see exactly which container is eating your RAM. Both update every 30 seconds. They're provisioned read-only so updates can improve them - to customize one, open it and use Save As to make your own editable copy.
8. Adding more dashboards
Grafana's community library at grafana.com/dashboards has thousands of ready-made dashboards. In Grafana go to Dashboards, then New, then Import, and paste a dashboard ID. Dashboards built for 'node-exporter' (try ID 1860) or 'cadvisor' work out of the box because SparkBox already runs both collectors. When the import asks for a datasource, pick Prometheus.
Next steps
That's Metrics & Dashboards live on SparkBox.
If something doesn't match what you see, post in d/sparkbox or hit us up on YouTube. Every SparkBox bug gets patched; every UX-stumble in this guide gets rewritten.